Quantification
Contents
Quantification#
import numpy as np
import pandas as pd
from datetime import datetime
import matplotlib.pyplot as plt

import sys
sys.path.append("../../")

# import our modules
from news import fetch_news_headline
from profit import calc_profit
Load Data#
stocks: pd.DataFrame = pd.read_csv("../../data/stocks.csv", index_col=0, parse_dates=True)
company = "TSLA"
stock = stocks.query(f"Company == '{company}'").drop(columns=["Company", "Sector"])
stock
| Open | High | Low | Close | Volume | |
|---|---|---|---|---|---|
| Date | |||||
| 2017-11-02 | 20.008667 | 20.579332 | 19.508667 | 19.950666 | 296871000 |
| 2017-11-03 | 19.966667 | 20.416668 | 19.675333 | 20.406000 | 133410000 |
| 2017-11-06 | 20.466667 | 20.500000 | 19.934000 | 20.185333 | 97290000 |
| 2017-11-07 | 20.068001 | 20.433332 | 20.002001 | 20.403334 | 79414500 |
| 2017-11-08 | 20.366667 | 20.459333 | 20.086666 | 20.292667 | 70879500 |
| ... | ... | ... | ... | ... | ... |
| 2022-10-26 | 219.399994 | 230.600006 | 218.199997 | 224.639999 | 85012500 |
| 2022-10-27 | 229.770004 | 233.809998 | 222.850006 | 225.089996 | 61638800 |
| 2022-10-28 | 225.399994 | 228.860001 | 216.350006 | 228.520004 | 69152400 |
| 2022-10-31 | 226.190002 | 229.850006 | 221.940002 | 227.539993 | 61554300 |
| 2022-11-01 | 234.050003 | 237.399994 | 227.279999 | 227.820007 | 62566500 |
1258 rows × 5 columns
Combine Stocks and News#
Intuitively, the news information can only provide us with very vague information about the stock price. In fact, it is already good enough if today’s news can tell us whether the stock price will increase tomorrow.
# shifted percentage change: (tomorrow - today) / today
df = stock[["Close"]].pct_change().shift(-1).dropna()

# whether the stock price will increase compared with today's price
df = df > 0
df.rename(columns={"Close": "Will Go Up?"}, inplace=True)
df
| Will Go Up? | |
|---|---|
| Date | |
| 2017-11-02 | True |
| 2017-11-03 | False |
| 2017-11-06 | True |
| 2017-11-07 | False |
| 2017-11-08 | False |
| ... | ... |
| 2022-10-25 | True |
| 2022-10-26 | True |
| 2022-10-27 | True |
| 2022-10-28 | False |
| 2022-10-31 | True |
1257 rows × 1 columns
Now, we attach the news headline on each date to the data frame:
DATABASE_FILEPATH = "../../data/news.db"

df["Headline"] = np.nan

for date in df.index:
    # correct date format
    date_str = datetime.strftime(date, "%Y-%m-%d")

    # fetch news headline from database
    headline = fetch_news_headline(DATABASE_FILEPATH, company, date_str)

    # attch news headline to data frame
    df.loc[date, "Headline"] = headline

df = df[["Headline", "Will Go Up?"]].dropna()
df
| Headline | Will Go Up? | |
|---|---|---|
| Date | ||
| 2017-11-02 | Okay Elon Musk, what's gone wrong with the Tes... | True |
| 2017-11-03 | Tesla hits bumps in pursuit of mass market | False |
| 2017-11-06 | Tesla Investors May Be Losing Patience | True |
| 2017-11-07 | Bloomberg | False |
| 2017-11-08 | Elon Musk met with Erdogan to discuss Tesla's ... | False |
| ... | ... | ... |
| 2022-10-25 | Update: Tesla Cuts Prices in China After Signs... | True |
| 2022-10-26 | Exclusive: Tesla faces U.S. criminal probe ove... | True |
| 2022-10-27 | From Tesla to SpaceX, what Elon Musk touches t... | True |
| 2022-10-28 | Wall Street asks if Musk can manage Twitter, T... | False |
| 2022-10-31 | Elon Musk has pulled more than 50 Tesla employ... | True |
1068 rows × 2 columns
Split training and test data sets:
num_days_left_out = 90
train_df = df[:-num_days_left_out]
test_df = df[-num_days_left_out:]
Word Embedding#
Our goal is to predict whether the stock price will go up tomorrow based on today’s news. So, it can be treated as a classification problem, more precisely, a binary classification problem. That is, we want to find a mapping / decision rule:
But the headlines consist of text data. Hence, we need to first transform or encode them to numerical data. This procedure is called word embedding.
Usually, we need to train an additional model for word embedding, which is quite troublesome. To reduce our workload, fortunately, there is a pretrained model prodived by the module sentence_transformers that is ready to use.
from sentence_transformers import SentenceTransformer
See also
Check the document of sentence_transformers for more information.
Encode the news headlines with the model SentenceTransformer:
# load pretrained model
headline_encoder = SentenceTransformer("all-MiniLM-L6-v2")

# encode news headlines to NumPy arrays
embeddings = headline_encoder.encode(train_df["Headline"].tolist())

print(f"embeddings.shape: {embeddings.shape}")
embeddings
embeddings.shape: (978, 384)
array([[-0.00946767,  0.01169717,  0.07283923, ..., -0.07292849,
        -0.02329506,  0.11975066],
       [-0.01846967, -0.02873902,  0.03534317, ..., -0.13485262,
         0.01329796,  0.13287042],
       [ 0.02563943, -0.04956274,  0.04786101, ..., -0.07707552,
        -0.05291679,  0.0715071 ],
       ...,
       [-0.00674385,  0.0027471 ,  0.09396511, ..., -0.09142395,
         0.01973804,  0.08486167],
       [-0.07479677,  0.01877449,  0.07296403, ..., -0.08446505,
         0.02360164,  0.05853827],
       [ 0.01585246,  0.05186599,  0.07435998, ..., -0.07771911,
         0.01394665,  0.05791727]], dtype=float32)
As we can see, each headline is transformed to an array with length 384.
Binary Classification Problem using SVM#
As mentioned, we want to solve a classification problem.
In terms of machine learning terminologies, each sample \((\mathbf{x}, y)\) consists of a vector \(\mathbf{x}\) representing 384 features (encoded news headline) and a binary label \(y \in \{\text{True}, \text{False}\}\).
The most popular choice is the Support Vector Machine (SVM).
from sklearn.svm import SVC

# prepare training data
X_train = embeddings
y_train = train_df["Will Go Up?"].to_numpy()

# train!
clf = SVC(C=1, kernel="rbf")
clf.fit(X_train, y_train)
SVC(C=1)
Prepare the test data follows exactly the same procedure as before:
X_test = headline_encoder.encode(test_df["Headline"].tolist())
y_test = test_df["Will Go Up?"].to_numpy()
Predict the whether price will go up or down:
y_pred = clf.predict(X_test)
ROC curve and AUC score:
from sklearn.metrics import roc_curve, roc_auc_score

fpr, tpr, thresholds = roc_curve(y_test, y_pred)
plt.plot(fpr, tpr, linewidth=2)
plt.plot([0, 1], [0, 1], color="k", linestyle="--")
plt.grid()
plt.show()
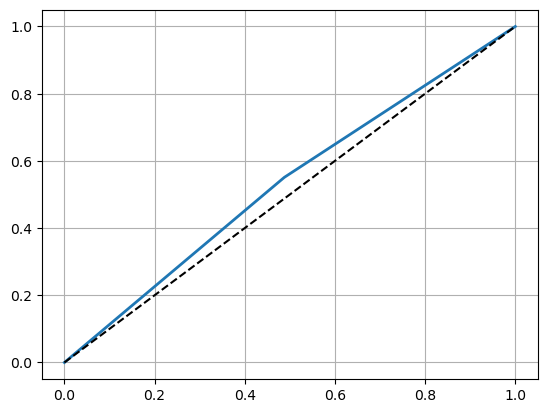
roc_auc_score(y_test, y_pred)
0.5316077650572424
Unfortunately, the value of AUC is only slightly grater than 0.5, which means the classifier not very satisfactory.
Profit#
Decide the dates to buy and sell:
# Find buying and selling dates
buy_dates = []
sell_dates = []
is_holding_shares = False
for i, date in enumerate(test_df.index):
    will_go_up = y_pred[i]
    if is_holding_shares:
        # price will go down, sell it!
        if not will_go_up:
            sell_dates.append(date)
            is_holding_shares = False
    else:
        # price will go up, buy!
        if will_go_up:
            buy_dates.append(date)
            is_holding_shares = True

# convert to Pandas `DatetimeIndex`
buy_dates = pd.DatetimeIndex(buy_dates)
sell_dates = pd.DatetimeIndex(sell_dates)

buy_dates, sell_dates
(DatetimeIndex(['2022-06-27', '2022-07-05', '2022-07-07', '2022-07-12',
                '2022-07-14', '2022-07-19', '2022-07-26', '2022-08-01',
                '2022-08-05', '2022-08-11', '2022-09-01', '2022-09-12',
                '2022-09-14', '2022-09-20', '2022-09-26', '2022-09-29',
                '2022-10-07', '2022-10-11', '2022-10-25'],
               dtype='datetime64[ns]', freq=None),
 DatetimeIndex(['2022-07-01', '2022-07-06', '2022-07-11', '2022-07-13',
                '2022-07-15', '2022-07-21', '2022-07-27', '2022-08-04',
                '2022-08-09', '2022-08-23', '2022-09-08', '2022-09-13',
                '2022-09-19', '2022-09-22', '2022-09-27', '2022-10-03',
                '2022-10-10', '2022-10-19', '2022-10-27'],
               dtype='datetime64[ns]', freq=None))
How much can we earn if the strategy is entirely news-driven?
start_date = test_df.index[0]
profit_rate = calc_profit(stock, buy_dates, sell_dates, start_date)
print(f"Profit rate: {profit_rate:.2%}")
Profit rate: 3.25%
The profit rate is only 3.25%, which lower than both SMA and prediction-based (LSTM) strategies.
Conclusion#
As we can see, it is not adequate to predict whether the stock price will go up or down tomorrow only based on the news. More delicate techniques are required in future works!